In recent years there have been some great resources on metrics for startups, in particular Dave McClures metrics for pirates and Andrew Chens articles on user acquisition and KissMetrics article on conversion. Over the last few products I worked on I synthesized this into a core model that I found very helpful. Here are some questions I had difficulty understanding early on that led to my approach:
- You notice that your power users all have taken some action (e.g. filled out their profile) so you try to encourage all users to fill out their profile to get them more hooked on your product. Does this actually help?
- You have 24 hours of downtime, the next day you come back up your traffic is down. Will this have a long-term effect you need to worry about?
- You have 100K uniques per day and so does your competitor, but are these 100K people who come back every day or 700K people who each come once per week? Does it matter?
- You turn on a new advertising campaign and see your # of unique visitors per day start to increase, you assume that this will continue increasing so long as you keep the ads running, right?
- You start having email deliverability problems (or Facebook turns off notifications) so you can’t notify users of new activity on the site. The # of unique visitors decreases slightly but you’re not too worried, should you be?
What follows is a detailed how-to for analyzing your product's customers.
The key insight is this: the most important thing is how many unique customers you have, and by implication, knowing what causes any change in this number. And by customers I don’t mean visitors or pageviews, I mean the subset of those people that will be long-term repeat users. Knowing how to measure those customers is the key concept that connects your pageviews, visitors, conversion funnel, retention %s, and all those other numbers you’re collecting and not quite sure how to make sense of. This isthe heart of your products and business’s success.
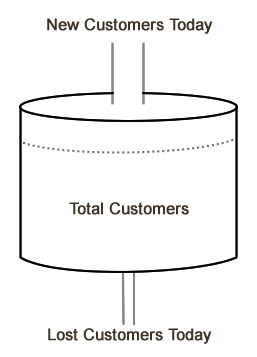
Here is the simple model:

The first step is to figure out how many new customers you add each day and to do this you have to define what makes a customer.
People seeing your product for the first time go through a series of first-time-visitor steps and then start using your product (landing page, registration, inviting their friends, etc). People usually refer to this series of steps as their new user funnel and the end of the funnel is usually some step like uploading their first photo or completing the first level in your game—some core action for your product. But where should your funnel end? This is actually a critical question that a lot of people get wrong; they misdefine the point of transition from a new visitor to an actual customer.
Here is how to figure it out. First, hopefully you’re already measuring the conversion from each step in the funnel to the next step: 50% of people who see the landing page click the sign up link, 60% of people who start signing up complete the process, etc. Ask yourself, when someone has been using your product for awhile, what count as a meaningful return visit? Say you have a photo sharing website. If someone returns but only looks at one page and doesn’t click anything, that probably doesn’t count. But if they come and get sucked in and view 5+ unique photos, I’d say that counts. Or if they view one photo but they comment on it, that probably counts too. Once you’ve defined a meaningful visit then you need to work backwards and find the point where % chance of a repeat meaningful visit is 95+ %.
To switch examples, say you created an online game. After your user completes the sign-up process and takes their first few turns, there is still a good chance they will not return. However, those users who have come back on 100 unique days (where they took a turn on that day) should have a near 100% chance of returning the 101st time to take a turn. Find the point in between where the drop-off hits 5%, meaning 95% of people who reach this point will return. At this point you can call someone a customer. In a game I worked on once, after someone cast 24 spells and had visited the game on at least two unique days, they were hooked. We only lost 1% of these people each day. This point was the end of our new user funnel.
(Note: if you don’t have a very sticky point like this, you may not have created a high-value product yet)
The second step is to figure out when you’ve lost a customer. After you’ve converted them from a visitor to a customer, by definition, you know you have a high likelihood of them engaging with the product again, but even these customers may not visit every single day. At what point have you lost them?
You should have an intuition about the interval between meaningful visits that you care about; start there and look for an unexpectedly long gap. In the game I mentioned above most people played every day (it was designed with this intent). A month after launch I grabbed all my customers who had played today and had been around for at least three weeks. I looked at how long of a break these people took. Lots of people skipped a day of playing, many skipped two or three consecutive days of playing, but very few took people ever took a 4 day break and came back again so after 4 days I considered a customer to be dead. For a second example, consider a product like Shazam on the iPhone (it identifies a song you are listening to). I use this product once month. Assuming this is okay to Shazam as a company (meaning that they can still build a successful business on people like me) then their lost point will be much different than with my game. I bet some Shazam users skip a month or two, but if you’ve skimmed four months you’ve probably forgotten about Shazam and have a very low chance of returning.
Carrying Capacity
At this point, every day you know how many customers you gained, how many you lost, and how many total you currently have. With this data you can now calculate your carrying capacity.
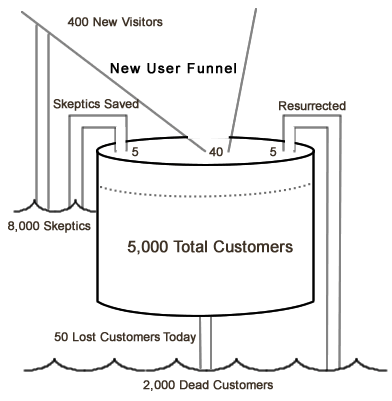
Lets say you have 400 new visitors each day (i.e. from Adwords or Facebook Ads) and 50 of them turn into new customers; and of your current customers you lose lose 1% of them each day. Your product will continue to grow until you reach 5000 customers and then it will stop. Why? Because the # of customers you add each day is mostly independent of your total audience size, whereas the # of customers you lose each day will steadily increase until you’re losing the exact same number of customers you gain each day. At this point you plateau.
Once you have reached this equilibrium state, if you increase your daily ad spend so you’re acquiring 75 new customers each day you’ll start growing again until you reach 7,500 total customers then you’ll stop. And conversely, if you keep your # of new customers the same but figure out how to get your daily loss to 0.66% you will also grow to 7500 customers and then level off.
Carrying Capacity = # of new daily customers / % customers you lost each day
(The reality is a little more complex than this because the # of new customers you get each day is influenced to some extent by the total # of customers you have, but you can tease out those effects later.)
Enhancing the Model
The next thing to understand is where your new customers are coming from. There are 3 possibilities worth isolating:
- This is a brand new person you’ve never seen before (usually from advertising, SEO, or referral)
- This is a former customer you considered lost or dead that has been resurrected
- This is someone who tried your product in the past but never became a customer; now they’ve come back and converted (I call these the skeptics)
Here is the original diagram expanded. In this picture you’ve added 50 new customers today but you isolated the three different sources (new, skeptics saved, resurrected). You also track the intermediate pools (skeptics and dead customers).
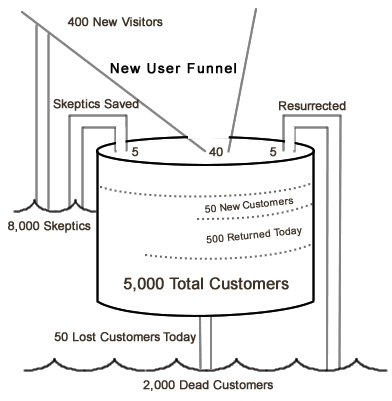
 There is one more expansion I find helpful. Within the 5,000 total customers pictured above, some % of those returned today so they’re as good as new. Here is what my full customer dashboard with that addition:

Virality
Virality is the one concept which has the biggest potential to impact this model. Most people look at virality in a simplified way. You take all the new people who tried your product today and see how many friends they brought (either today or on any day in the near future). If 50 people came today and they inspired 25 of friends to come over the next few days then you’re K-factor is 0.5 (each new visitor will bring 0.5 friends). This doesn’t have any impact on the model I explained above. See the 400 new visitors? If your K-factor is 0.5 this just means you only had to buy 266 of them, the other 134 came for free. Correction: You only had to buy 200 of them, the other 200 came for free. I was only considering the second generation of free visitors, but these will bring a third generation, which will bring a fourth, etc. A K-factor of 0.5 means 1/(1–0.5)=2 times the number of users you bought will ultimately come. Any K-factor less than 1.0 is essentially just a discount on advertising spend (0.5 equals a 33% discount 50% discount).
What most people overlook is that retention has a huge effect on your K-factor. Sure, most of the invitations people send occur in the first visit or first few days of using a product; this is why you initially spend so much time optimizing your new user funnel and trying to get people to refer their friends as part of this. However, after this first-visit kicker most users who come to love your product and stay around for a long time will continue to refer a steady stream of their friends. This can give you a nice bump to your lifetime K-factor and give you a greater chance of getting it over 1.0.
Note: In the case that your first-visit viral coefficient is greater than 1.0, things can be very confusing without having a clear model like the one above. You could be converting 0% of your visitors to customers (i.e. all the water going into your bucket is instantly flowing out), but you’re steadily turning up the water since each new visitor is bringing more than one friend. You will see a steady increase in all your naive measurements of success (i.e. unique pageviews and visitors per day) but in reality you may not be acquiring any customers.
Benefit
In closing, lets revisit the example questions I raised at the start. Here is how this model helps:
- You notice that your power users all have taken some action (e.g. filled out their profile) so you try to encourage all users to fill out their profile to get them more hooked on your product. Does this actually help? Without this model its easy to mislead yourself into thinking it helps. You will probably be able to increase the metric but it may just weaken the correlation with power users. However, with this model you just watch your loss % each day and if it doesn’t change then you haven’t had any net impact on retention.
- You have 24 hours of downtime, the next day you come back up your traffic is down. Will this have a long-term effect you need to worry about? Even if your traffic is lowered for a few days, all you have to do is measure your new visitors per day & lost customers per day and you’ll see if your carrying capacity has changed. If it has not changed then you don’t have to worry, you know your traffic will rise back up to your carrying capacity.
- You have 100K uniques per day and so does your competitor, but are these 100K people who come back every day or 700K people who each come once per week? Does it matter? If you’re incorrectly caught up in # of unique visitors per day then this does seem like an important thing. And in fact, if you realize your visitors are not returning as often as your competitors you may even be tempted to spam them regularly because this will increase # of unique visitors each day and can give you the illusion of improving things. In reality a move like this would probably increase your % lost each day and hurt your carrying capacity but you wouldn’t notice this for awhile because the increased # of uniques each day would mask the harm. However, with the model your emphasis is on # of customers not # of visitors. You’ll quickly realize that you don’t care how frequently people visit as a primary factor; if it doesn’t impact # of new customers per day or % of lost per day then you haven’t actually helped your product.
- You turn on a new advertising campaign and see your # of unique visitors per day start to increase, you assume that this will continue increasing so long as you keep the ads running, right? Nope, you’ll level off once you’ve reached your new carrying capacity.
- You start having email deliverability problems (or Facebook turns off notifications) so you cant notify users of new activity on the site. The # of unique visitors per day decreases slightly but you’re not too worried, should you be? This is similar to question 3, it may or may not be important but you’ll quickly be able to tell by focusing on the core numbers. Increasing # of unique visitors per day does not necessarily lead to more total customers.